

I have shipped a MongoDB query that ran in 4 milliseconds on my laptop and took most of a second in production. Same code. Same query. Same indexes, or so I thought. The only thing that changed was the data, and that turned out to be the only thing that mattered.
These days I don’t trust “it works on my machine” for database queries at all. Not because my machine is lying on purpose, but because a small dev database simply can’t tell you how a query behaves at scale. Here is how I catch these problems before they ship.
Why your dev data lies to you
There are three ways a local database fools you, and they usually show up together.
- Size. Scanning 300 documents is instant. Scanning 3 million is not. A full collection scan feels free when the whole collection fits in a few pages of memory.
- Distribution. In dev, every user has five orders. In production, one wholesale customer has 80,000 and the rest have two. The query that filters by that customer behaves very differently from the average.
- Cardinality. If your seed script sets
statusto “active” on everything, an index onstatuslooks either useless or perfect, and neither tells you the truth about real traffic.
So the query isn’t fast in dev. It is just small. Those are different things, and the only way to tell them apart is to ask MongoDB what it actually did.
Ask the database, not the stopwatch
Timing a query locally tells you almost nothing. The explain method tells you how the query was executed, which holds true no matter how much data you have. I run it in executionStats mode:
db.orders.find({ customerId: 42, status: "paid" })
  .sort({ createdAt: -1 })
  .explain("executionStats")
Then I look at a handful of fields, described in the explain results docs:
| Field | What I want to see |
|---|---|
| winningPlan stages | IXSCAN, not COLLSCAN |
| nReturned | The number of documents you actually got back |
| totalKeysExamined | Close to nReturned |
| totalDocsExamined | Close to nReturned, ideally equal |
| SORT stage | Absent, meaning the index already gave the order |
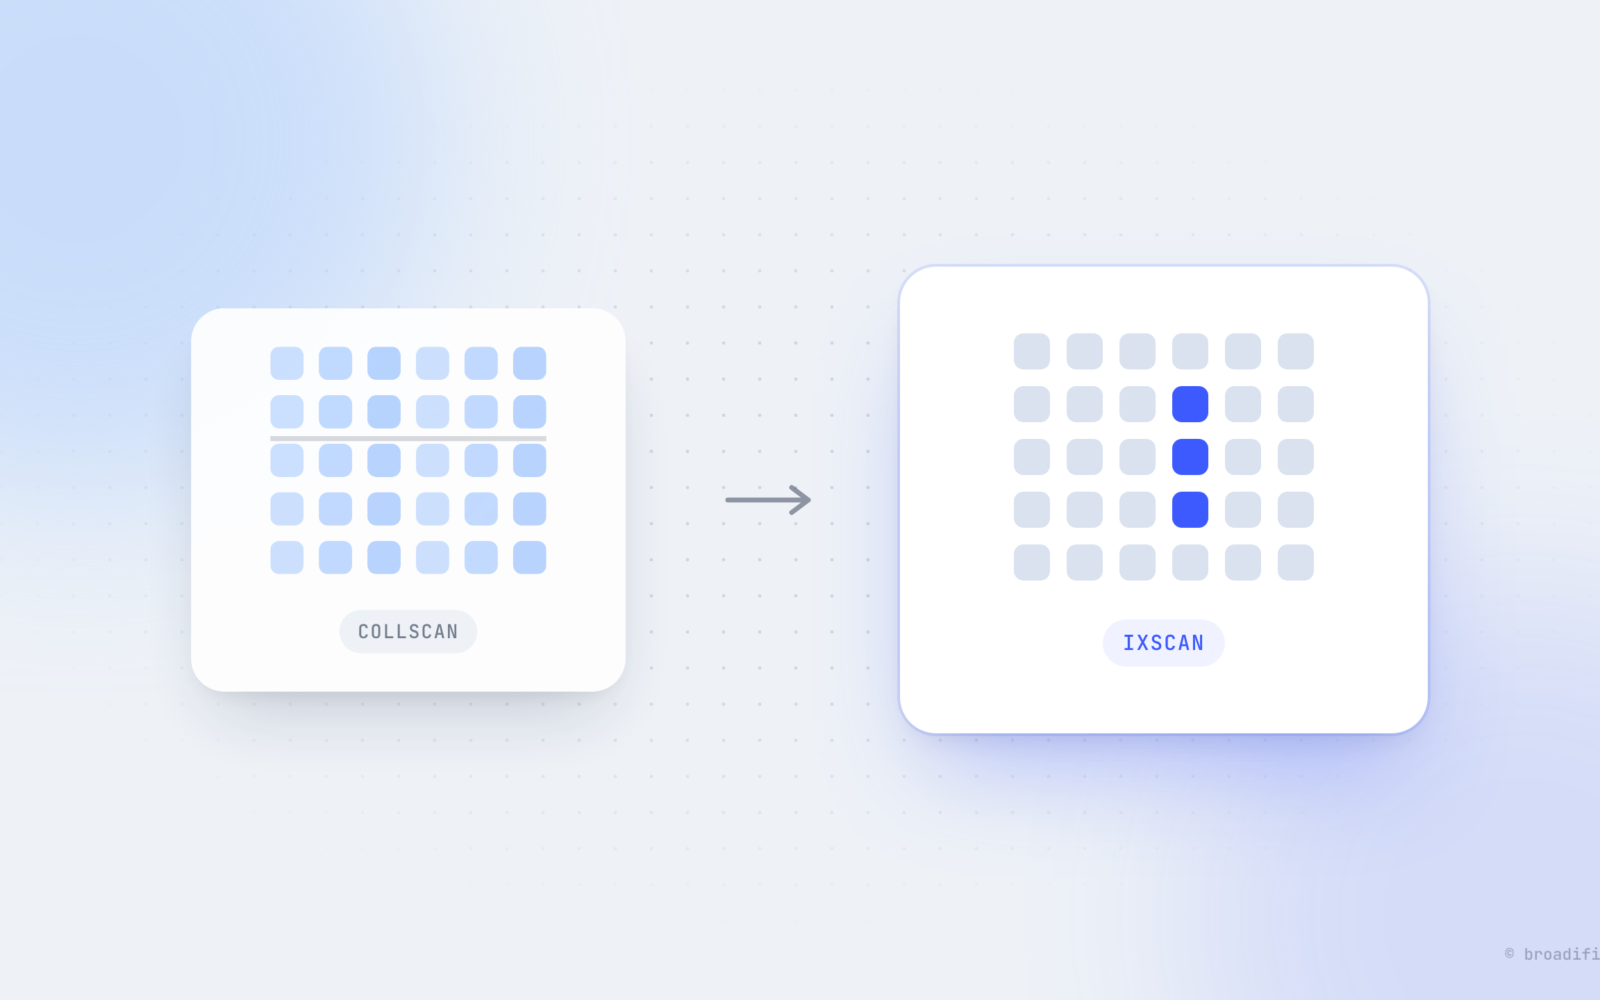
COLLSCAN means MongoDB read every document in the collection. On a dev box with 500 documents that is invisible. In production it is the whole problem.
The ratio is the part people skip. If a query returns 20 documents but examined 40,000, it doesn’t matter that it used an index. It used a bad one, or a good one in the wrong order. I treat that ratio as the real test. It scales with your data, so a bad ratio in dev is a warning about production, even when the timing looks fine.
Compound index order matters more than people think
Most slow queries I’ve debugged weren’t missing an index entirely. They had an index with the right fields in the wrong order. MongoDB documents a simple rule for this, the Equality, Sort, Range guideline:
- Equality fields first, the ones you match exactly (
customerId: 42). - Sort fields next (
createdAt). - Range fields last (
total: { $gt: 100 }).
For the query above, that means:
db.orders.createIndex({ customerId: 1, status: 1, createdAt: -1 })Put createdAt first and the index can still be used, but MongoDB walks a lot more keys and may sort in memory. Put a range field before the sort field and the sort has to happen in memory, which shows up as a SORT stage in explain. The compound index docs are worth ten minutes of your time if you haven’t read them.
Make your local data less polite
You don’t need a full production copy to catch most of this. You need data that is big enough and uneven enough. My rough approach:
- Seed a few hundred thousand documents in the collections that matter, inserted in batches with
insertMany. - Make it skewed on purpose. A few “whale” customers with huge order counts, most with very few.
- Give low cardinality fields realistic splits, like 90 percent “delivered” and a thin slice of “pending”.
- If you can get an anonymized sample of real data, use it. Real shapes beat clever generators.
Then run explain against the whale customer, not the average one. The worst case is the one that pages you at night.
Let production tell you what it sees
Even with good habits, some queries slip through. So I want production to report slow operations on its own. MongoDB logs operations slower than the slowms threshold (100 ms by default), and the database profiler can record them into system.profile:
db.setProfilingLevel(1, { slowms: 100 })

db.system.profile.find({ millis: { $gt: 100 } })
  .sort({ ts: -1 })
  .limit(10)
Level 1 only records slow operations. Profiling has a cost, so I keep it targeted and don’t leave level 2 running on a busy production database. If you are on Atlas, the Query Profiler and Performance Advisor give you the same signal with less setup.
Read the slow entries for the same things you look for in explain: plan summary, keys examined, docs examined, documents returned. The numbers usually point straight at the missing or misordered index.
The short checklist I run before shipping a query
- Run explain(“executionStats”) on the real query shape, with real filters and sort.
- No COLLSCAN on any collection that will grow.
- totalDocsExamined is close to nReturned.
- No in-memory SORT stage for queries that sort.
- Compound index follows Equality, Sort, Range.
- Tested against skewed seed data, including the biggest customer.
- The index is created in production before the code that needs it goes live.
- Slow query logging or the profiler is on, so you hear about it if you got it wrong.
That list takes a few minutes per query. It has saved me hours of “why is the dashboard slow” more times than I can count.
The tool I ended up building
Part of why I built Ognom, a free and open-source MongoDB desktop client, was that I kept doing this dance by hand. In Ognom, Find, Aggregate and Shell show the matched count, timing and explain plan next to the results, so checking the plan is something you see every time instead of something you remember to do. There is also a database overview that flags unindexed collections and an index view that points out unused indexes, which helps on the other side of the problem: indexes that cost writes and never help a read.
Connections marked as production open read-only too, enforced in the API layer, which ties into something I wrote earlier about production safety being an architecture decision. Poking at a slow query in production should never be one typo away from changing data.
But honestly, use whatever you like. Compass, mongosh, Atlas, Ognom, a notebook full of explain output. The habit matters more than the tool. Read the plan, check the ratio, and stop believing a query is fast just because your laptop said so.
If you want to see the other open source work we do at Broadifi, it lives on our open source page.
